Bitcoin and Ethereum Market Analysis – 10.02.2021
Bitcoin recorded a beautiful breakout and new highs in the last 24 hours with some consolidation(as expected). This surprise new all-time high to $46,759 lifted sentiment across the market.
Sentiment plays a major role in the short-term price action of an asset.
BTC price retracement and weakening on-chain metrics are forcing traders to be cautious in the short term. This is a signal that, a short phase of consolidation could continue the next few days.
The best climate for Altcoins is an upward moving Bitcoin as this gives investors a calm market environment to trade them. This has contributed to Ethereum as well.
At the BTC daily chart, We see a clear bullish breakout after holding the significant key level at $38,500.
If the BTC/USD pair drops to the breakout level at $41,959.63, the price may rebound off this support and bulls can push the price above $48,152.84.
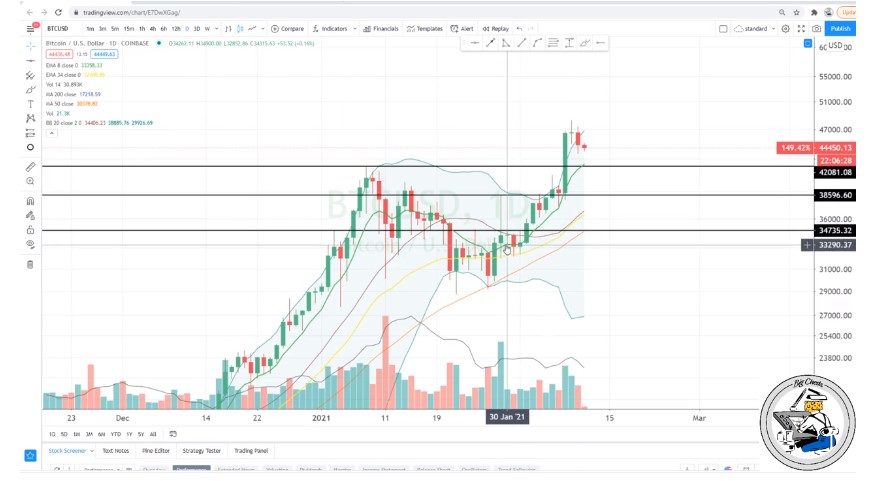
Fig.1.Bitcoin: Doji candlestick pattern indicating a loss in momentum.
Paid Content by Peter Brendt and his partners at bitcoin.live
I don’t give the bears a chance here, to break and sustains below $41,959.63 as the bulls have regained the EMA 8 and also bearing in mind of the wider adoption by institutional investors.
BTC weekly Chart shows that the up-sloping moving averages suggest advantage to the bulls, but the divergence on the relative strength index (RSI) points to a weakening momentum. Above all, the OBV is strong, even though there will be some retesting and consolidations, it’s going to be bullish all the way.
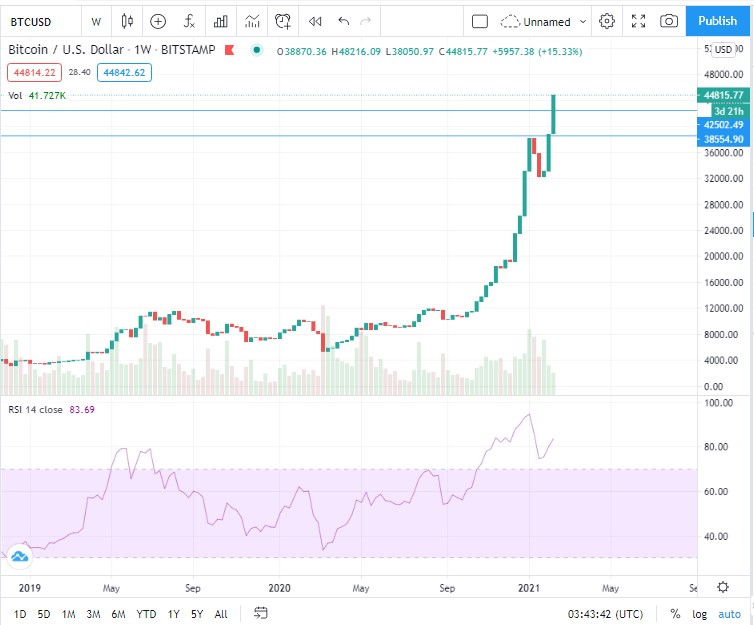
Fig2. Bitcoin: The stop loss to should be moved to $41,959.63 even though the OBV is strong to suggest continuation. Source: bitcoin.live
Let’s keep it simple and stick with our plan of buying dips until proven otherwise.
Ethereum
Ether (ETH) made a new all-time high today, but the long wick on the candlestick suggests that traders are booking profits at higher levels. The failure of the biggest Altcoins to pick up momentum after breaking above $1,757.338 indicates that demand dries up at higher levels.
The ETH/USD pair may witness a minor correction or consolidation that could pull the price down to the 20-day EMA ($1,514). This is an important support to watch out because, the bulls have not allowed the price to sustain below it for the past three weeks.
If the price rebounds off the 20-day EMA, it will suggest that traders will continue to view the dips to this level ($1,514) as a buying opportunity. The bulls will then try to resume the uptrend and push the price to $2,000 psychological level.
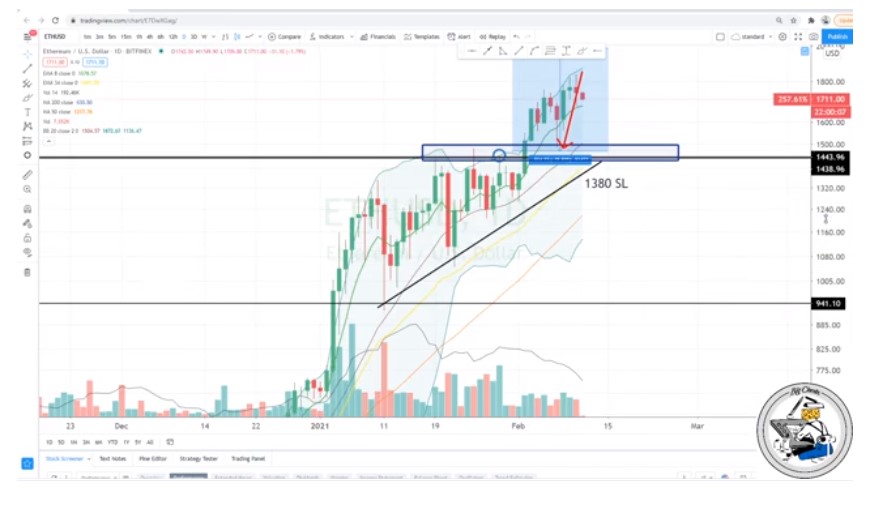
Fig.3 Ethereum: $1,514 is the key support area to watch-out. Source: bitcoin.live
Ethereum remains bullish and it’s Inching ever closer to that ascending triangle goal of $1970.
Top Takeaways
$BTC 42k area support 48k area resistance
$ETH $1580 area support $1970 area resistance