Crypto Market Analysis/Ideas/Signals – 09.04.2022
Bitcoin and Ethereum ANALYSIS
The crypto market entered into a correction for the past 4 days after BTC’s price got rejected at $48k resistance level. Trading below this key level (200-day SMA) signifies presence of bull trap and this downswing may induce fear that could lead to massive sell-off.
Everyone expected one more move up (another high) to complete the first half of the 60-day cycle but rather, we got an unhealthy pull back from BTC and some major Altcoins. There’s is no cause for panicking yet, as long as the downswing does not hit the prior cycle low ($37.5k).
From Mid-term point of view, we’re looking at a right translated cycle forming at two peaks (in May and the next Cycle-June).
BTC daily chart shows a trendline, attempting to test lower support level at $41.6K (100-day MA). The price action is trapped in the indecision range where it could either rally up or pull back significantly. The Mar 27 advance has faltered, although on a closing price basis support, has held firm.
Short term, BTC is trying to make the most of the spring rally up, that seems to be failing at each attempt. The bullish thesis is still intact until possibly the price going below $40k support level for final capitulation.
For me, it’s a different trade now and would wait for the possible mid low to form and have a clearer picture.

Chart 1: The price action is trapped in the indecision range where it could either rally up or pull back significantly.
Source: Paid Content by Peter Brendt and his partners at bitcoin.live , BTCUSD Chart by TradingView
BTC weekly chart is still looking good and above the 10-week MA. Breaching the 10-week MA is where I will get concern in the intermediate time-frame.
I still believe that, we’ve come to the end of the intermediate period of the declining channel. Still long BTC, stops on the leveraged position are now at $40k and $37.5k.
As long as the 60-day cycle low is still holding nicely, we might end the cycle (mid-term frame) on a higher high. Breaking above the $48k significant resistance barrier opens up the possibility for a right translated cycle.
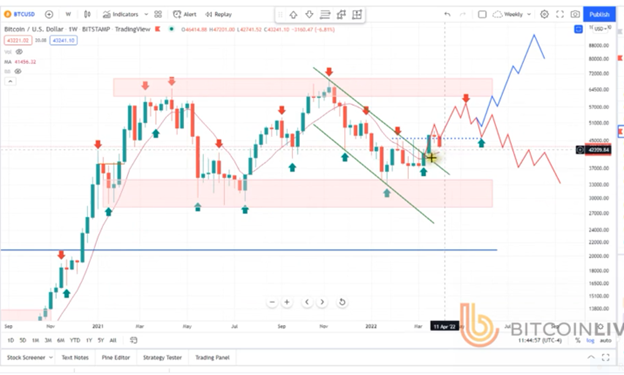
Chart 2: The chart is still looking positive and above the 10-week MA.
Source: bitcoin.live , BTCUSD Chart by TradingView
Ethereum
Ethereum has more strength than BTC, trending above 10-day MA. This chart needs to hold that $3000 psychological level. Any price action below this level will prolong bear action.
Looking at the chart, if we can break above the top of the hammer, one would anticipate that a move to the $3500 level would be possible. The $3500 level has been a significant resistance barrier recently, and breaking above that level, opens up the possibility for more upside.
On the downside, if we were to break through the moving averages, that could have this market looking to take out the $3000 level underneath, which has been important multiple times. Giving that up would then open up a move down to the $2500 level which had been so significant support, as we had formed the “double bottom” at that level.
From the mid-term point of view, Ethereum is more bullish than bearish.

Chart 3: Ethereum still has more strength than BTC trending above 10-day MA.
Source: bitcoin.live , ETHUSD Chart by TradingView
Bitcoin and Alt SIGNALS and Trading Ideas or Comments
#BTC/USD had a clear rejection at $48k and price making lower highs since then to indecision range with a potential downturn wanting to show up.
I felt it was important to update on what I’m seeing as well as what the math of the SmartMoney Algo is displaying.

***In reference to the 8-hr and daily – The confusing part for the 8-hr and daily comparison is this. Both are displaying a trend change and even a pull-up in a downtrend. There is no real consistency.
At first glance, it’s telling me there is indecision with a potential downturn wanting to show up.
This is time to trade less right now. Waiting for a proper trade, opportunity or sign is what the most successful do. Sometimes trading and the markets are so exciting it’s hard to keep track of everything and sometimes there is really nothing you can or should be doing.
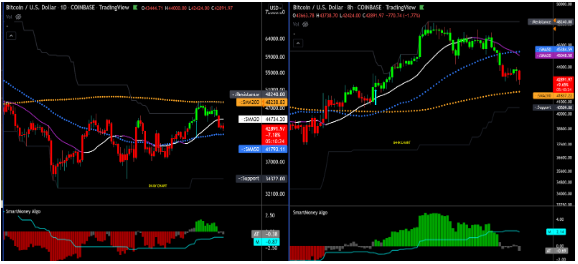
Chart 4: BTC/USD had a clear rejection at $48k and price making lower highs. Source: bitcoin.live
ROSE/BTC: The same situation is for a lot of Alts.
ROSE has resistance in its way but starting to have confluence. This is an indecision time where we could have a short set up or long one. What we happen in overall market will help to know the prevailing trend.
The accumulation range must hold! Must get above the 20SMA to get more movement.
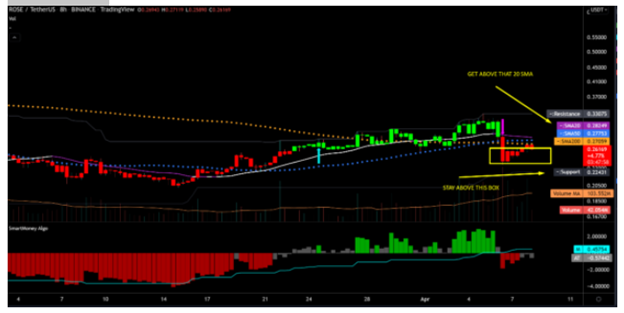
Chart 5: screenshots of the 8-hr where ROSE has resistance in its way but starting to have confluence: Source: bitcoin.live
Mid Term Market PROGNOSIS (1-2months)
Altseason will take a little longer than expected but looking bullish. Bitcoin dominance BTC.D bearish. The overall sentiment on a short-term is bearish. BTC needs to break back above both the 50 WMA & HMA Band following this current dip & find support. This could be a big task. Macro mid term outlook is unchanged.

Chart 6: $BTC.D,Short-term bearish. Source: @illiquidmarkets
For now, BTC rejected by the HMA band & 54.00 RSI.
The best scenario would be some weeks of consolidation above the HMA band & 54.00 on RSI similar to 2020 to retain the bullish trend.

Chart 7: $BTC rejected by the HMA band & 54.00 RSI. Source: @illiquidmarkets
I’d like to mention some other notes about Altseason.
Just check these latest developments: BTC.D is slipping off as BTC is consolidating in an indecision range while USDT.D is falling with USDT having a big breakout straight into a typically bearish pattern which might continue till May time-frame.
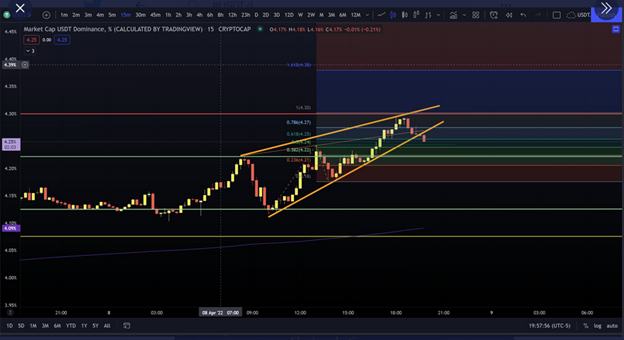
Chart 9: USDT.D is in bearish pattern which might continue till May time-frame. Source: @Its_My_Purpose
Status of Crypto market in Short(1-2 weeks) and Mid Term (1-2 months)
Bearish on short term.
Mid-term could go either way in the 1-2 months but more bullish.