Bitcoin and Ethereum Market Analysis – Jul-4-2025
5-Day Bitcoin (BTC) Price Analysis (July 4, 2025)
Below is a 5-day price analysis for Bitcoin (BTC) against USD, based on technical indicators, recent market trends, and sentiment from available data. This analysis uses information from various web sources and posts on X, focusing on the period around July 4, 2025, and incorporates key technical indicators like RSI, moving averages, and support/resistance levels. Note that cryptocurrency markets are highly volatile, and this analysis is not financial advice—always conduct your own research.Current Price and Market ContextPrice as of July 4, 2025: Approximately $109,783 USD, based on aggregated data from multiple exchanges.
24-Hour Trading Volume: Approximately $14.51B to $59.31B, depending on the source, indicating significant market activity but a potential decline in volume compared to the previous day (-32.9% according to CoinGecko).
Market Sentiment: The Fear & Greed Index is at 73 (Greed), suggesting strong investor confidence but potential overbought conditions.
Recent Performance:1-Day: +2.13% (Yahoo Finance).
7-Day: +1.7% (CoinGecko).
30-Day: +4.38% (Changelly).
All-Time High (ATH): $111,888 (May 22, 2025), with the current price ~1.88% below the ATH.
Bitcoin is trading within a rising trend channel in the medium to long term, reflecting increasing optimism among investors. However, short-term fluctuations and resistance levels suggest potential volatility over the next five days.
Technical AnalysisMoving Averages (MAs):Bitcoin is currently trading above all major exponential moving averages (10, 20, 50, 100, and 200-day EMAs) on the daily chart, indicating a bullish trend.
The 50-day, 100-day, and 200-day MAs are key support levels. A drop below these could signal weakness, with the nearest support around $108,143.
The MACD Oscillator is likely above the zero line, reinforcing bullish momentum, though crossovers between short- and long-term MAs could signal shifts.
Relative Strength Index (RSI):14-Day RSI: ~63.58 (daily) and ~63.48 (weekly), indicating neutral conditions—neither overbought (above 70) nor oversold (below 30).
Some sources note bearish signals in RSI, suggesting possible downward pressure if momentum weakens.
On shorter timeframes (e.g., 4-hour), RSI is showing oversold conditions, which could precede a bounce.
Support and Resistance Levels:Resistance: $111,909 (near the ATH) is the first major hurdle. A decisive break above this could push BTC toward $115,727 or higher.
Support: $108,143 is a critical level. A break below could lead to a decline toward $103,500 or even $97,000–$94,000, as suggested by some analysts.
A fair value gap (FVG) exists between $108,000–$109,000, where price action may consolidate or face resistance.
Chart Patterns:Bitcoin recently broke a rectangle formation and resistance at $106,000, signaling potential for further upside.
However, a pennant pattern has been noted, with some analysts predicting a drop to $103,500 if the price fails to break the seller zone ($108,500–$109,500).
Short-term consolidation is possible, with a horizontal trend channel indicating investor uncertainty. A break above or below this channel will determine the next move.
Volume Analysis:Volume has decreased by ~32.9% in the last 24 hours, suggesting reduced market activity that could precede a larger move.
Investtech’s Volume Balance tool indicates strength when prices rise on high volume and fall on low volume, which aligns with recent bullish trends.
Based on the technical indicators and market sentiment, here are potential scenarios for Bitcoin’s price over the next five days:
Bullish Scenario:Trigger: A decisive close above $111,909 with sustained high volume.
Outcome: Bitcoin could rally toward $115,727 or higher, potentially reaching $142,761 by July 8, as predicted by CoinCodex.
Rationale: Strong bullish momentum, supported by the rising trend channel and positive sentiment (Fear & Greed Index at 73), could drive new highs. The recent breakout above $106,000 and ETF inflows (~$10B since November 2024) further support this case.
Probability: Moderate to high, given the bullish technical setup and market optimism.
Bearish Scenario:Trigger: Failure to break $111,909, followed by a drop below $108,143 support.
Outcome: Bitcoin could decline to $103,500 or lower, potentially testing $97,000–$94,000, as noted in some X posts.
Rationale: Bearish RSI signals, overbought conditions on shorter timeframes, and a potential rejection at the $108,000–$109,000 resistance zone could lead to a correction. Consolidation within the horizontal trend channel also supports this possibility.
Probability: Moderate, especially if volume remains low and selling pressure increases.
Neutral/Consolidation Scenario:Trigger: Price remains between $108,143 and $111,909, with no clear breakout.
Outcome: Bitcoin consolidates within the $108,000–$110,000 range, potentially filling the FVG around $108,000–$109,000.
Rationale: The neutral RSI (~63.58) and fluctuating trading volume suggest indecision. A horizontal trend channel in the short term indicates investors are waiting for a catalyst.
Probability: High, given current market uncertainty and lack of a strong directional breakout.
Key Events and Catalysts to WatchMacro Events: U.S. economic data (e.g., inflation reports, Federal Reserve statements) could influence Bitcoin’s correlation with traditional markets. The recent Federal Reserve rate cut (September 2024) has historically boosted BTC prices.
ETF Inflows: U.S. spot Bitcoin ETFs are approaching $50B in total net inflows, with $9.9B added since November 2024. Continued inflows could support bullish momentum.
Whale Activity: Recent movement of 20,000 BTC from wallets dormant for 14 years has sparked speculation about potential selling pressure.
Geopolitical Factors: Escalated Middle East conflicts have previously caused short-term price dips (e.g., 4.7% drop).
Regulatory News: The appointment of a crypto-friendly SEC Commissioner (e.g., Paul Atkins) could further boost sentiment.
Conclusion and RecommendationsExpected Price Range (July 4–July 9): $103,500–$115,727, with consolidation likely between $108,000–$110,000 unless a breakout occurs.
Trading Strategy:
Long: Enter above $111,909 with a stop-loss below $108,143 for a potential move to $115,727+.
Short: Consider shorting if the price breaks below $108,143, targeting $103,500 or $97,000, with a stop-loss above $110,000.
Wait: If uncertain, monitor for a breakout above $111,909 or below $108,143 to confirm direction.
Risk Management: Use tight stop-losses due to high volatility. Monitor volume and RSI for signs of reversal or continuation.
Key Levels to Watch:Upside: $111,909, $115,727, $142,761.
Downside: $108,143, $103,500, $97,000–$94,000.
This analysis is based on the latest available data and sentiment as of July 4, 2025. Always verify real-time price movements and conduct your own research before making trading decisions.
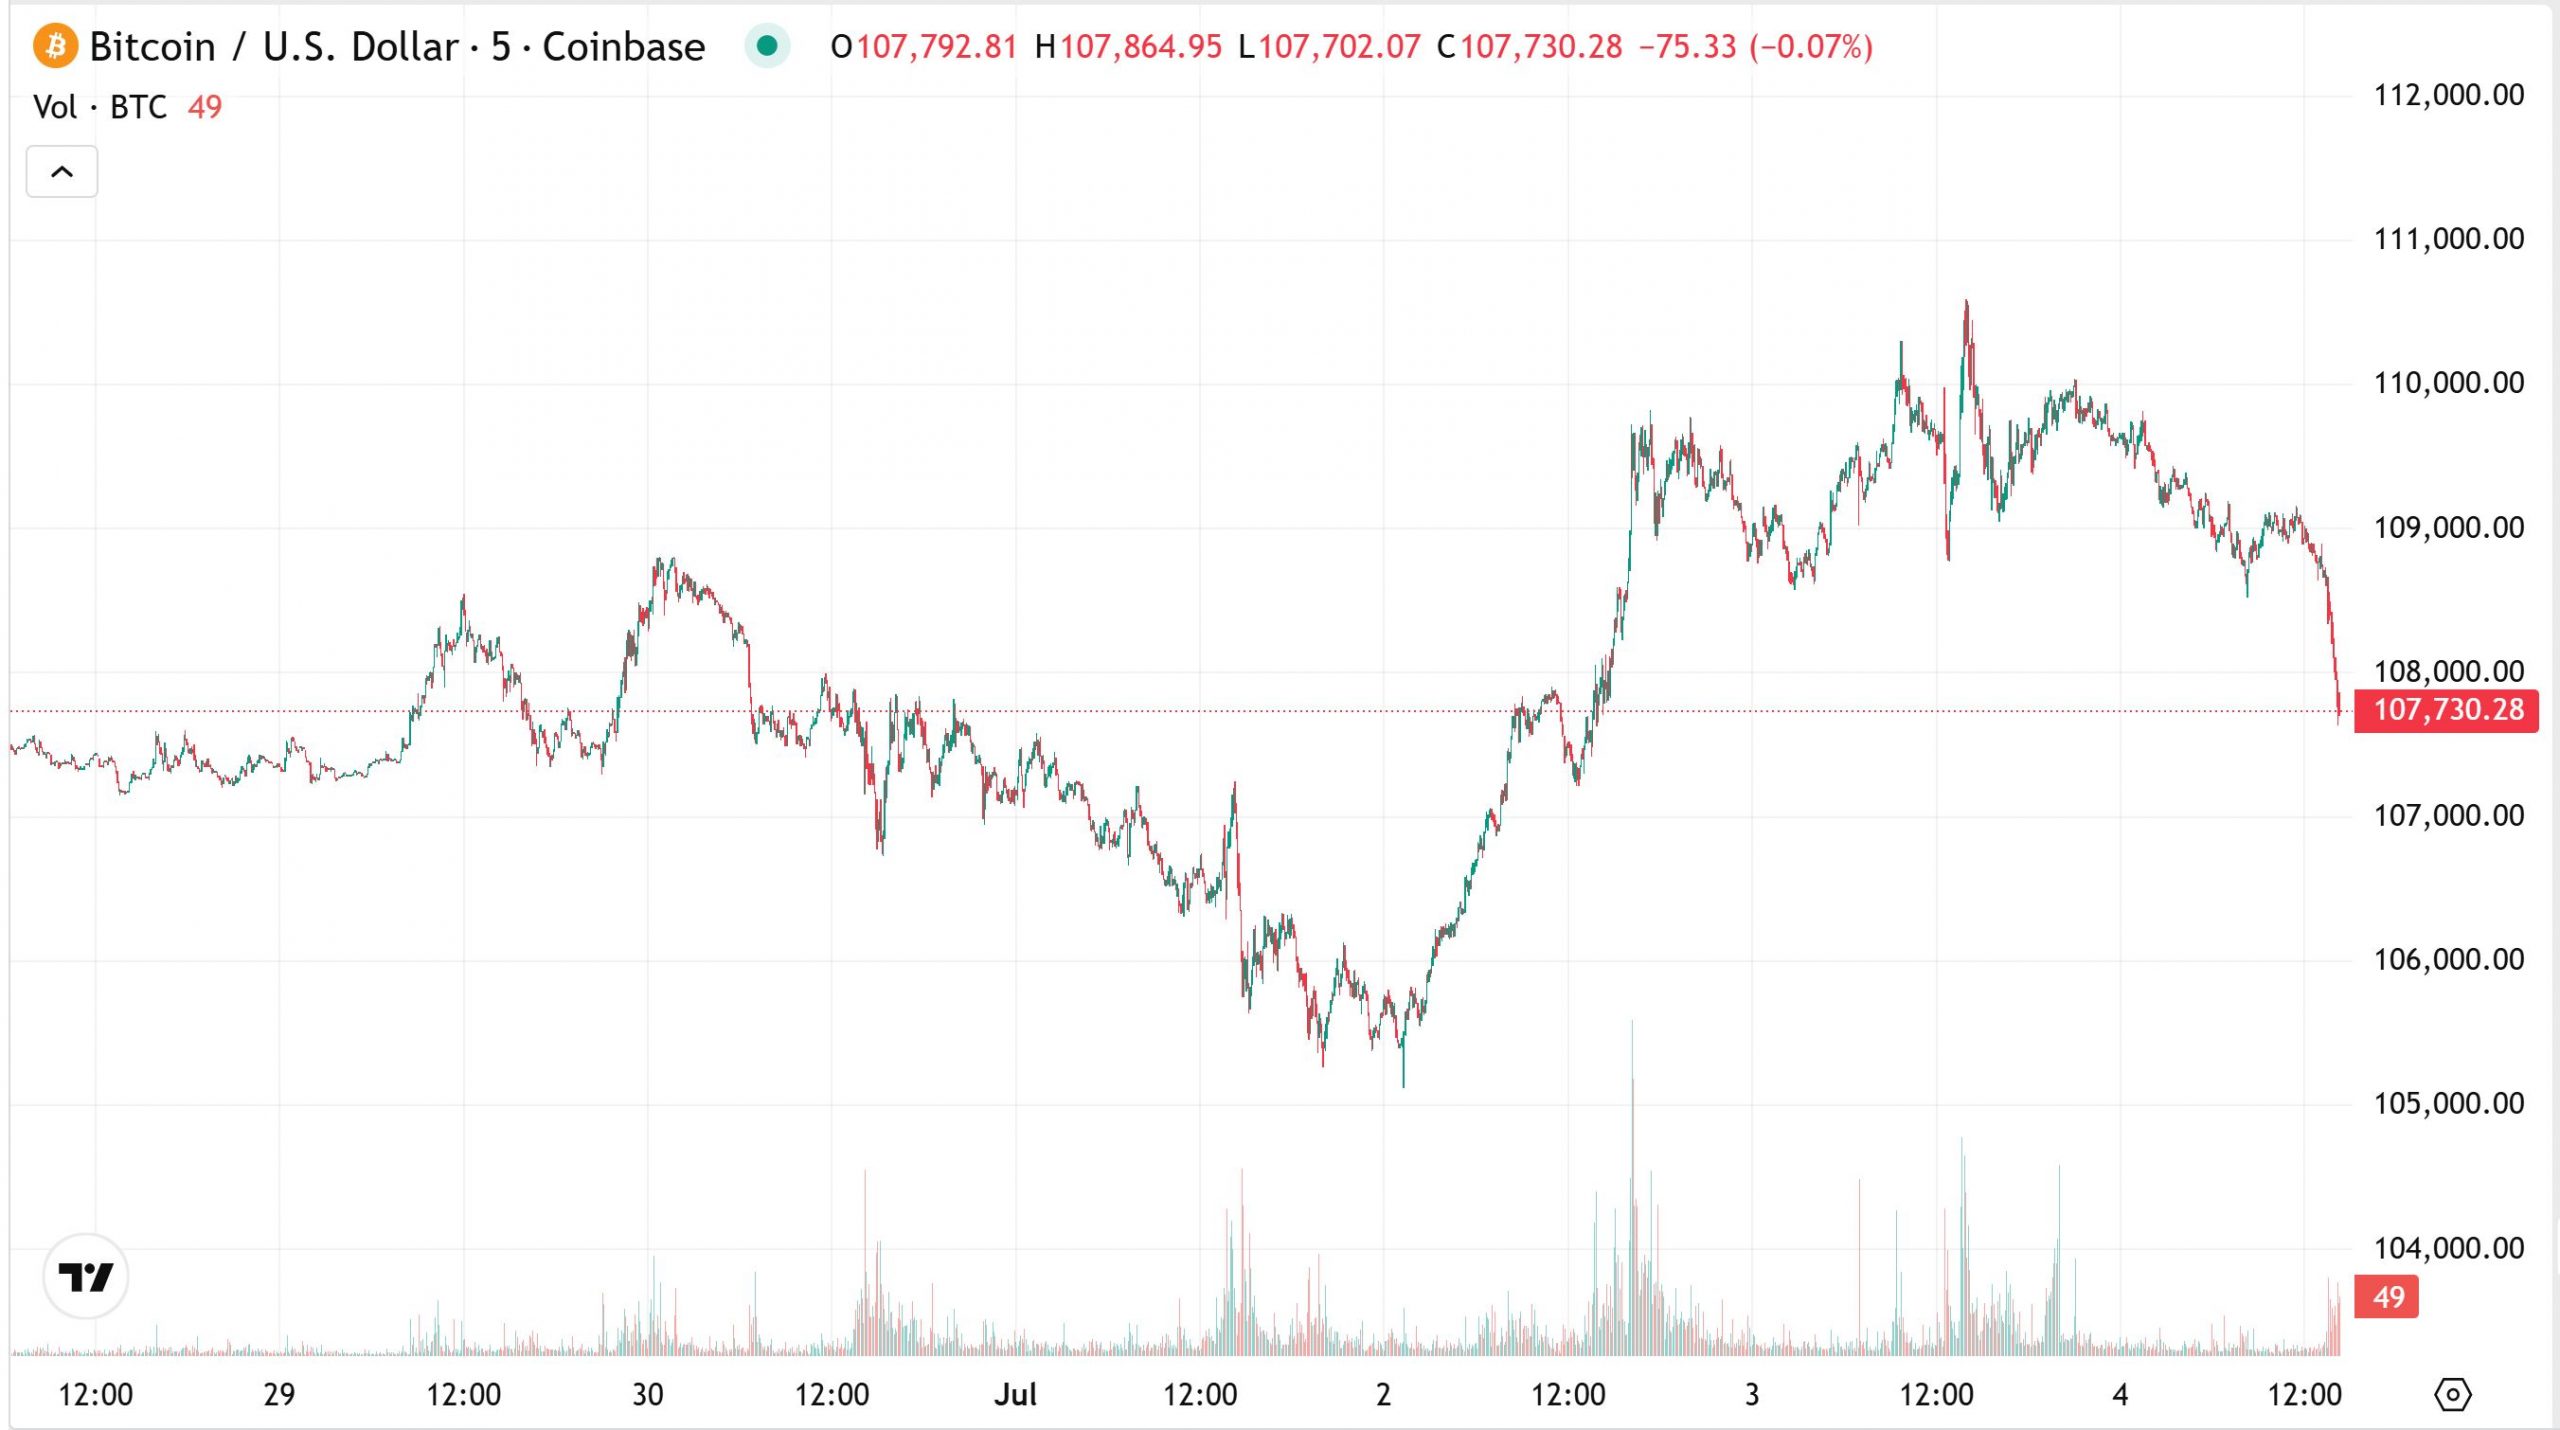 Chart . BTC price is struggling to break-out from the range in either direction but the bullish narrative has
held well.: Source: Paid Content by : bitcoin.live , BTCUSD Chart by TradingView