Bitcoin Market Analysis – 23.03.2022
Bitcoin is still sitting long and the chart is “marginally” bullish at the moment. We’re beginning to have a bullish set-up as the cycle low is beginning to pave the way for a counter trend rally. $BTC is trading at 21-day highs with few green candles in a row, signaling that the bull market may be fully back.
A move to the upside of the new 60-day cycle is under-way and I don’t see anything stopping it to make a good run up to $52-53k, even to $59k in the next cycle.
We need to let the market come to our strategy and let’s see what will unfold in the new 60-day cycle.
For me, this is the time to stay super focused and committed to the long/upside possibility.
The BTC daily chart shows a more tightening BB, few green candles in a row and a 10-day MA rallying high. Once, we go past the $46-47k level, we’ll be in the rising portion of the cycle leading to a right translated cycle.
Right now, this counter mover is not yet clean but I think, we’ll be leaving the downtrend behind if the momentum continues. If it continues, we can close up to $53k, then $59k key level will be within reach pretty soon.
Let’s hope, the bearish scenario will not be re-enacted when BTC goes beyond the mid-cycle high of day-18 and everybody gets excited, only for the price to capitulate to the previous cycle low of $33-34k level.
We have had enough downward move, what the market requires now is an upward move to reset sentiment and push the BTC price higher.
We need to get back to our core position plan and let the market reposition itself for more upside.
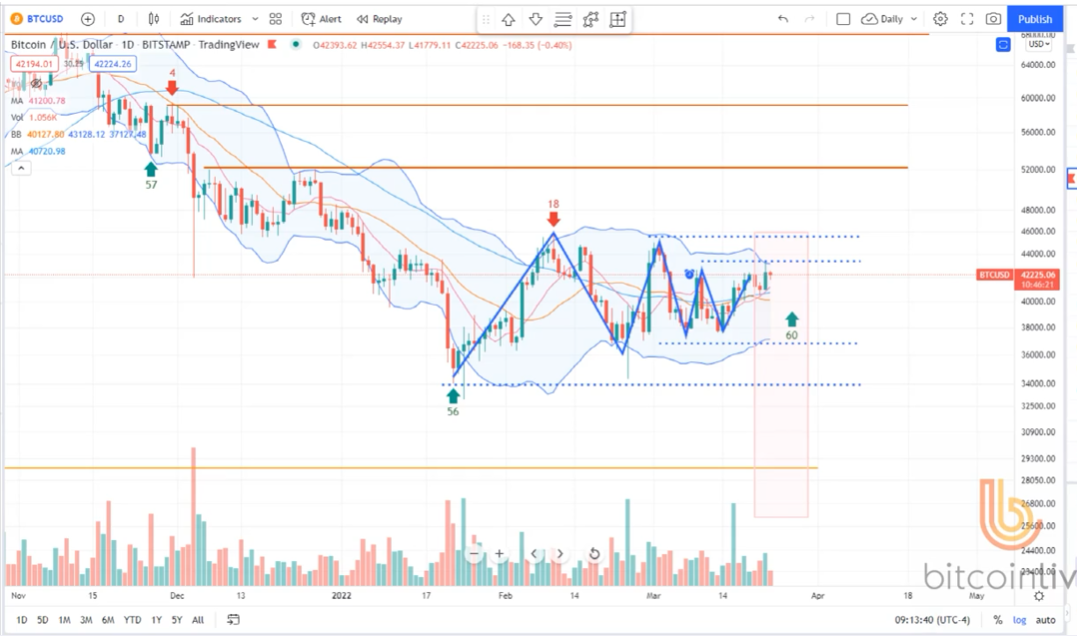
Pic.1: Tightening BB, few green candles in a row and a 10-day MA rallying high.
Source: Paid Content by Peter Brendt and his partners at bitcoin.live , BTCUSD Chart by TradingView
BTC weekly chart remains constructive as it looks more bullish with the breaking the declining range that lasted for 20 weeks. The 10-week MA is beginning to turn higher which is a confirmation that, the next phase of the rising portion of the 4-year cycle is about to begin.
For the fact that, we didn’t break down and make a lower low is a positive sign, but also, we have to be mindful of any bearish scenario that could counter our expectation.
Let’s be patient and wait for more confirmations that, the declining phase of the market is over.
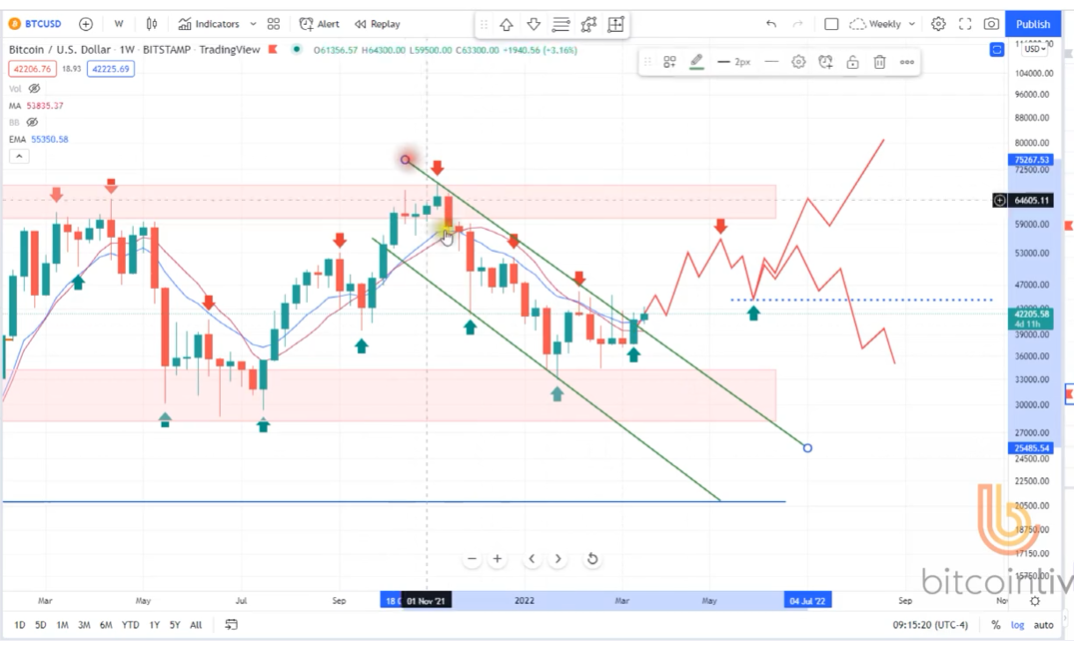
Pic.2: The chart remains constructive as it looks more bullish with the breaking the declining range that lasted for 20 weeks.
Source: bitcoin.live , BTCUSD Chart by TradingView
Ethereum
ETH is looking decent, It has broken the declining trend even though; it’s not yet a green light.
Let’s see all the moving averages trend above the range bound and that will get us back to our full core position.
Everything is aligning in a sort of the same strategy with Bitcoin and the new 60-day cycle will re-affirm whether the rising portion is back to shoot at another ATH.
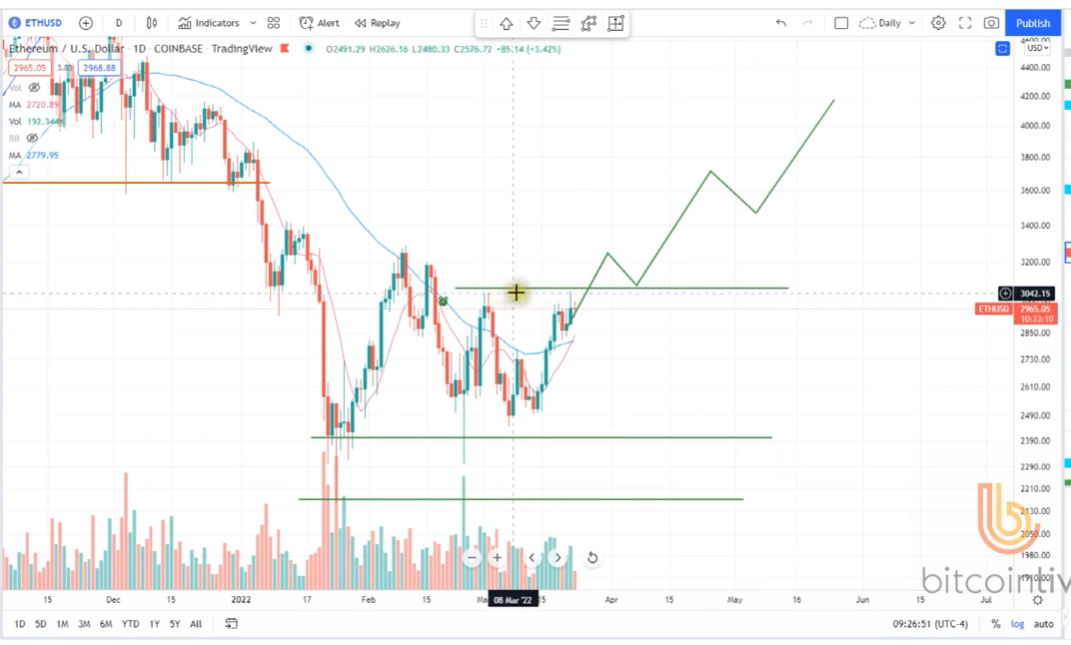
Pic.3: ETH is looking decent, It has broken the declining trend.
Source: bitcoin.live , ETHUSD Chart by TradingView