Bitcoin Market Analysis – 21.03.2022
The last days of the 60-day cycle have been fairly bullish, still holding well on day-56 of the cycle. These last 4 days of the cycle, for BTC not trading below $40k means, the selling pressure is reducing and this has put the entire market in a bullish atmosphere.
Nothing substantial has changed in the overall outlook, even though, there are areas of concern but as a long-term holder, nothing to worry about. It is all about how we approach the market and the discipline we put in to meet our expectation(s).
BTC daily chart shows a significant side-way consolidation, BB getting tighter for a strong trend move.
The capturing of the 10-day MA has given us a nice set-up but we should also be mindful of a drop to test the $34k level. Athough, any drop to that area will take out the lows and give us a cleaner pattern that could lead to a big rally.
On the upside, if BTC continues to move side-ways, we should start to look at couple of key levels. The first one here, is the March 9 high, may be few hundred dollars above that, up to $43k will give the bulls an edge, heading to a new cycle high.
In overall, this will give a positive sentiment that could see off the selling pressure and get us above the day-18 high to something around $52-53k.
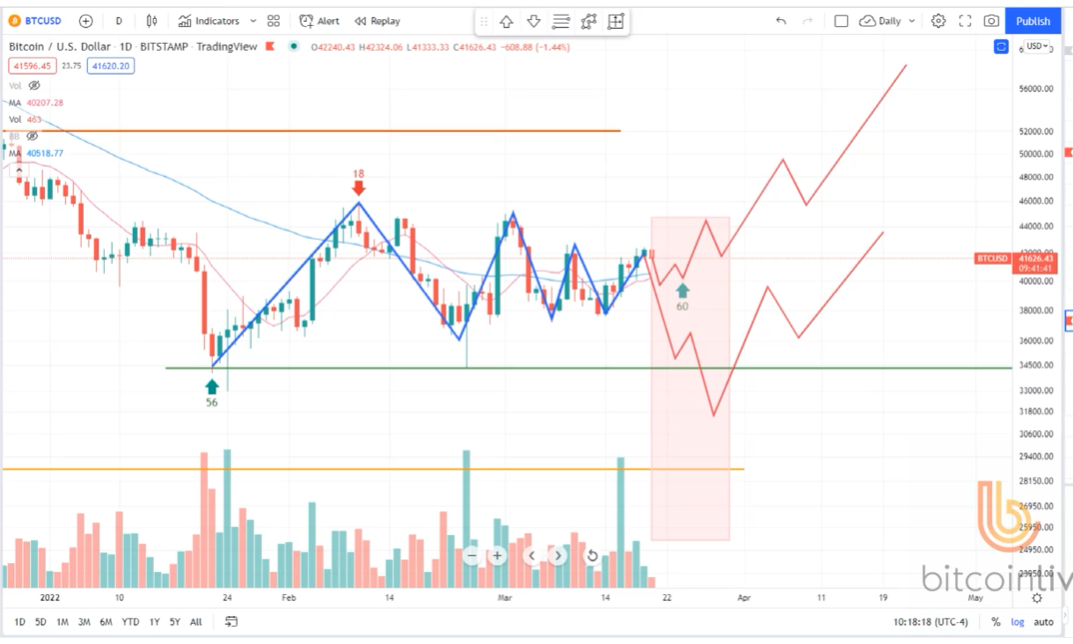
Pic.1: A significant side-way consolidation, BB getting tighter for a strong trend move.
Source: Paid Content by Peter Brendt and his partners at bitcoin.live , BTCUSD Chart by TradingView
BTC weekly chart shows a move above the trend channel, that has repositioned the entire structure to favor the bulls. Depending on how the long green candle closes, as it will determine the next line of actions.
I’m looking at the next cycle to be more of a rally-up but we shouldn’t rule out any possibility of having a significant drop that could form a clean 60-day cycle low (double bottom); putting BTC in a pole position to spring up for a big rally.
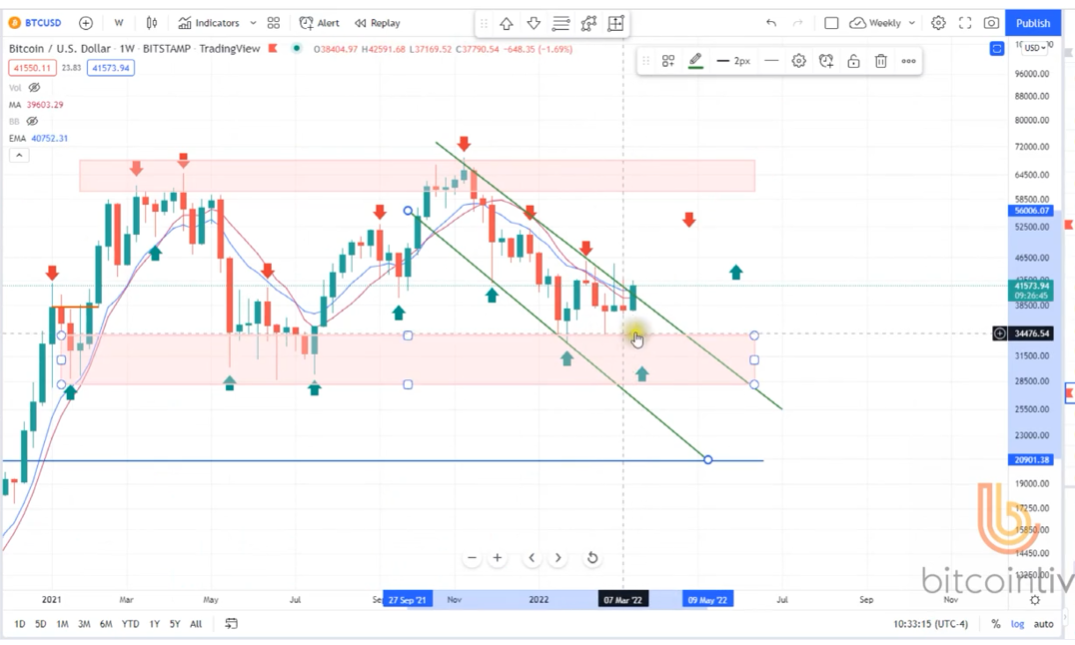
Pic.2: A move above the trend channel, that has repositioned the entire structure to favor the bulls.
Source: bitcoin.live , BTCUSD Chart by TradingView
BTC monthly chart shows the price action sitting below the 10-month MA, with a double top. The last time the 4-year cycle peaked was April last year and the entire structure looking bearish in the last six months.
In this 4-year cycle, we’ve had two major runs, a lot of shake outs, back and front, grinding action that swept the feeble minded away. The 4-year cycle rewards those who follow strategies with a longer term plans in mind.
I don’t expect any significant drop before May. What I see from a cycle point of view is consolidation up to the May time-frame. I’m looking forward for a May high, then a slight drop before any peak into an ATH.
From investment point of view, hold on to your long position and everything will be fine.
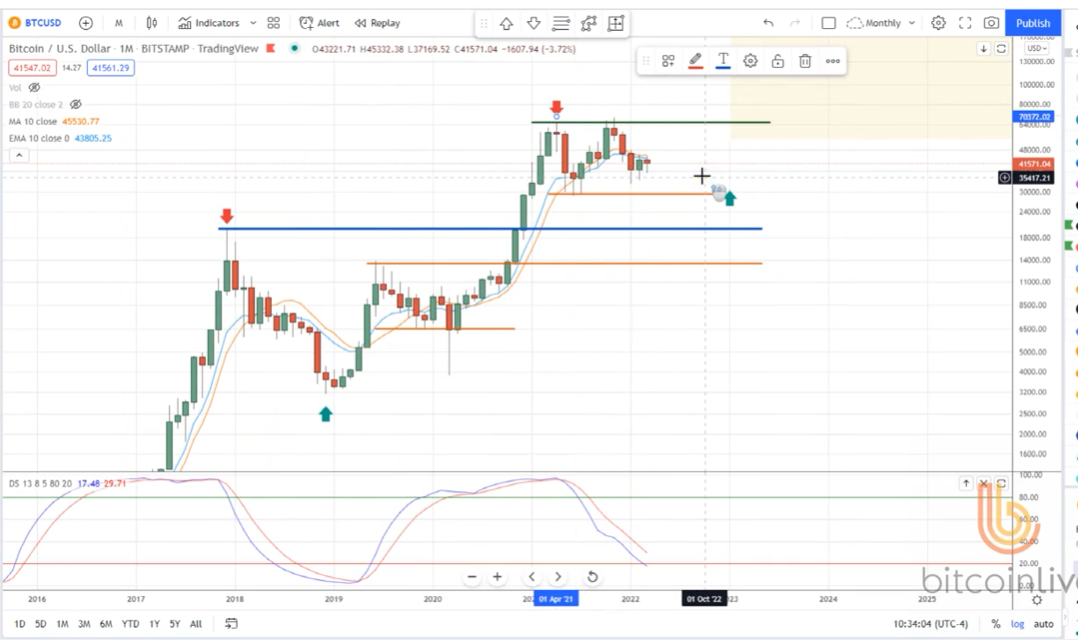
Pic.3: Price action sitting below the 10-month MA, with a double top and the entire structure looking bearish in the last six months.
Source: bitcoin.live , BTCUSD Chart by TradingView