Crypto Market Analysis/Ideas/Signals – 30.03.2022
Bitcoin and Ethereum ANALYSIS
Still bullish on Bitcoin and major altcoins, held the highs yesterday, before the shallow pullback. We have had a nice move for BTC with eight green candles in a row in the daily chart over the last few days.
Right now, BTC/USD is grappling with its 200-day SMA as bulls prepare to test the 50k level. It’s right up to next resistance at 48.7k (bull trap) to allow such move to happen. I think this will be the last hurdle before hitting the target of 59k psych level.
All you can do now is sit tight, and let your strategy work its magic.
BTC daily chart shows nice bullish setup with the uptrend. The counter trend move is being trapped in the congestion area of 47.6k level. We need cross over this congestion area (200-day SMA) to have a clean bull signal and to put the 50k key level in focus.
Alternatively, a drop could push prices down to the 45-46k area.
The sentiment is still relatively flying to make a strong counter-trend move. But for now, I can only assume it’s going to be a counter-trend move, in an asset under a cyclical bear market decline into the end of the year. That’s why I’ve been saying recently we now have to move to a more actively managed approach of one 60-day cycle at a time.
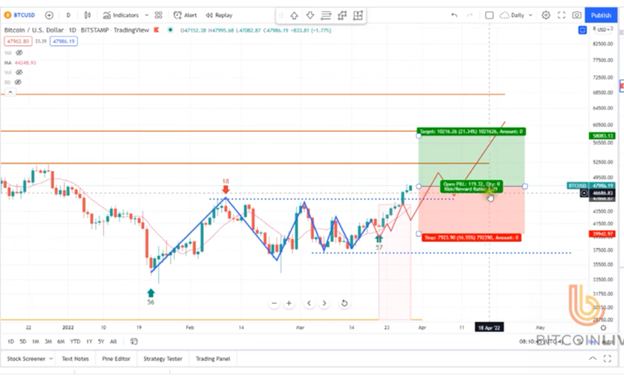
Chart.1: The counter trend move is being trapped in the congestion area of 47.6k.
Source: Paid Content by Peter Brendt and his partners at bitcoin.live , BTCUSD Chart by TradingView
BTC weekly chart shows all indicators looking good for a spring rally here. The setup is bullish, and it looks as if we could run sharply for a long time. The 10-week MA is clearly above the declining trend channel and the BB trending higher.
We need to clear up that 48.7k resistance area which might be the last obstacle before a new Bitcoin all-time high.
Like I said in the last analysis, let’s not rule out any possibility of having a significant drop, even though the new 60-day cycle has started on a positive note and everything seems to be aligning well.
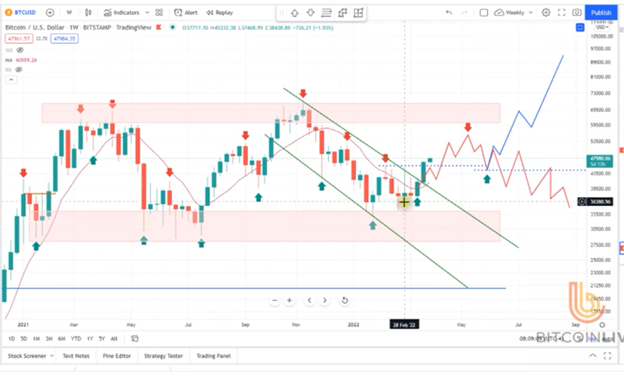
Chart 2: The 10-week Ma is clearly above the declining trend channel and the BB trending higher.
Source: bitcoin.live , BTCUSD Chart by TradingView
Ethereum
The same scenario with ETH, very bullish, having surpassed the Feb. High and looking to form a right translated cycle.
As we can see, the new 60-day cycle is trying to form a clean chart pattern with series of lower lows having been broken.
The key psychological resistance of $3,400 (congestion area) needs to be flipped into support, to allow further upside and to raise ETH’s possibilities to hit $4,000.
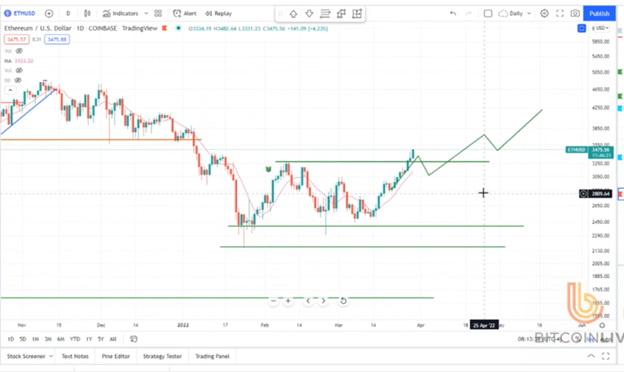
Chart 3: The same scenario with BTC, very bullish having surpassed the Feb. High and looking to form a right translated cycle.
Source: bitcoin.live , BTCUSD Chart by TradingView
Bitcoin and Alt SIGNALS and Trading Ideas or Comments
1st Altcoin Idea:
Stellar (XLM/USD)
Price: Resistance Level of $0.20 Is broken, targeting $0.25. Meaning that, Stellar is obeying the command from triple bottom chart pattern formed. The bulls are gaining more pressure and price is increasing towards the resistance level of $0.25. It can be longed at that key level and profit taken at $0.30.
The long and medium term trends are bullish.
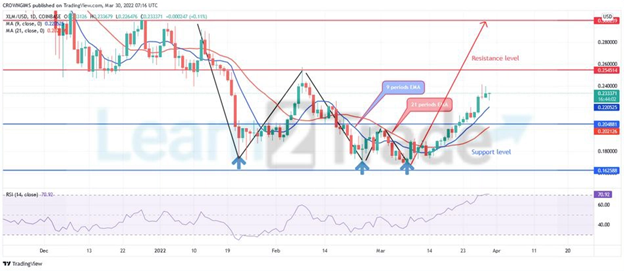
Chart 4: XLM/USD Long-term Trend: Bullish. Chart by TradingView
2nd Altcoin Idea:
Origin Protocol (OGN)
Had an incredible 227% gain from 13th to 20th this month, OGN has shed some 26%, currently trading between 0.591 – 0.656.
OGN outlook is neutral for now; it’s been trading near its midpoint for the past five days.
However, a significant breach above the 200-day MA around 0.68 will be our bullish entry. On the other hand, our bearish entry comes in below 0.55.
In either case, these will be our medium-term targets:
R1 = 0.69
R2 = 0.823
R3 = 0.992
R4 = 1.1
S1 = 0.54
S2 = 0.452
S3 = 0.378
S4 = 0.3
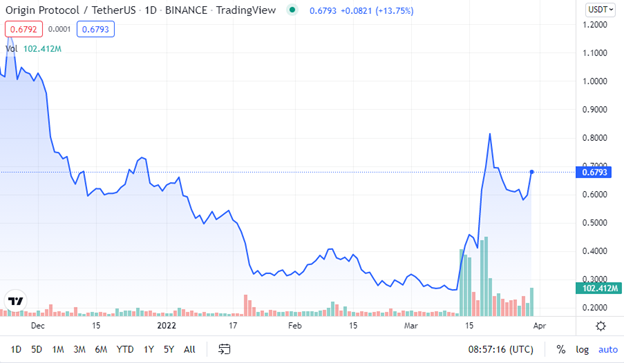
Chart 6: OGN outlook is neutral for now; it’s been trading near its midpoint for the past five days. Chart by TradingView
Mid Term Market PROGNOSIS (1-2months)
I’d like to make comment on well known S2F model of Plan B (@100trillionUSD).
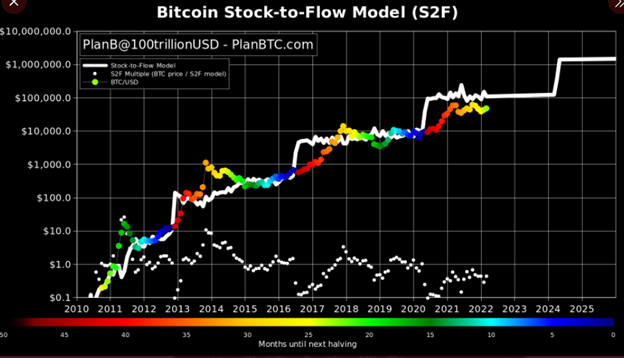
Some people think that because bitcoin crashed on green in 2014 & 2018, BTC will crash again on green in 2022. But this could be coincidence. BTC can also pump on green (like 2011).
Color just indicates months until next halving. S2F says nothing about WHEN BTC pumps or crashes.
The longer the range, the more $BTC we can accumulate. Simple, but it takes patience. Don’t let the 15m chart kill your portfolio.
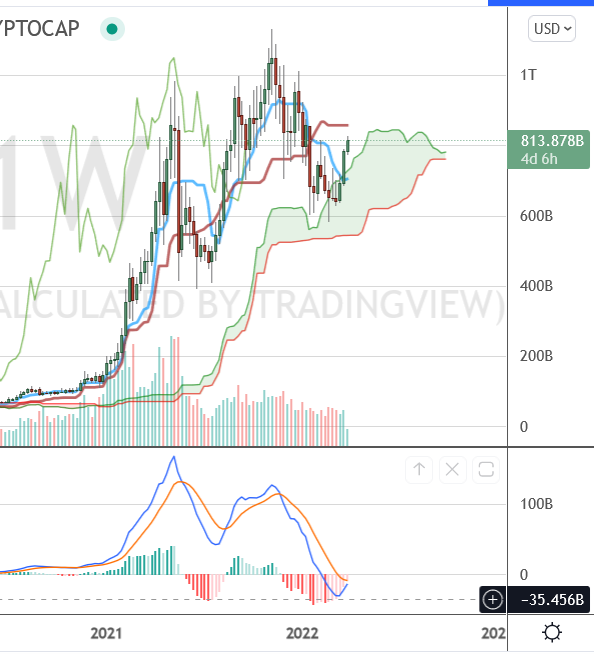
$BTC Moving sideways for 10-20 days would be a TOTAL bliss for alts at this point as on INDEX Total 3 MACD 1W is going to make Golden Cross soon!!
Status of Crypto market in Mid Term (1-2 months):
Medium term Bullish on Bitcoin and major altcoins. Pump incoming in the next 1-2 months, up to May time-frame.